
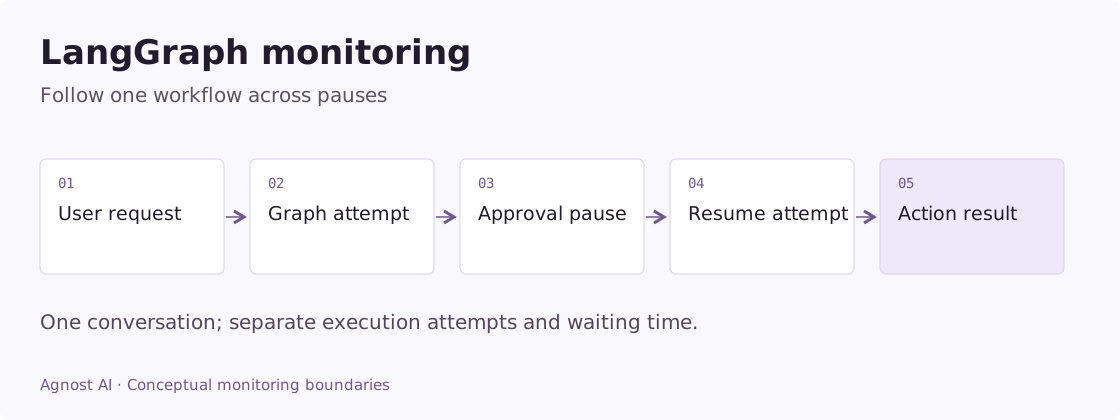
A LangGraph agent may pause for approval, resume on another request, revisit a node, and eventually return an answer. Treating each HTTP response as a finished task loses the workflow. Treating the whole thread as one uninterrupted model call hides where the time went.
LangGraph observability needs both execution history and persistent workflow identity. Track each invocation as an attempt, preserve the conversation across resumes, and distinguish a completed answer from a graph waiting for input. Node traces then explain how the workflow reached that state.
Agnost AI records agent interactions through its SDK and ingests supported OpenTelemetry traces. Its LangChain/LangGraph integration provides the setup paths. A wrapper around graph.invoke() captures that boundary; it does not automatically expose every node, checkpoint, or state update.
How to debug a LangGraph agent
For a graph compiled with a checkpointer, start with the affected thread. Inspect graph.get_state(config) and graph.get_state_history(config); history is returned newest first. Compare the last expected step with the first unexpected transition. The official checkpoint guide describes these inspection methods.
# Read-only inspection of your existing checkpointed graph.
config = {"configurable": {"thread_id": affected_thread_id}}
snapshot = graph.get_state(config)
print("Next nodes:", snapshot.next)
for checkpoint in graph.get_state_history(config):
    print(checkpoint.created_at, checkpoint.next)
Inspect approved state fields locally when you need more detail. Avoid printing the entire state into shared logs. Check whether the workflow is waiting for approval, has a failed task, or repeatedly routes to the same node. Replaying a checkpoint executes subsequent work again; review external side effects before using replay as a debugging shortcut.
Use this inspection to explain one execution. In Agnost, connect its recorded interaction to the user and conversation, then investigate whether the same failure recurs across requests. A conversation wrapper does not provide a checkpoint debugger.
Worked example: an approved action is performed twice
Imagine a LangGraph expense workflow that prepares a reimbursement, pauses for approval, and resumes when a reviewer responds. This is an illustrative design review, not a production incident report.
| Evidence to record | Example meaning | Why it matters |
|---|---|---|
| Stable thread and conversation | One reimbursement request | Links both execution segments |
| First attempt ends paused | Approval is outstanding | Prevents a false failure classification |
| Resume starts a new attempt | Reviewer supplied a decision | Separates active execution from waiting |
| One business action ID | The intended reimbursement | Detects duplicate external effects |
| Payment system result | Accepted, rejected, or pending | Establishes the authoritative outcome |
If two payment records exist for one action ID, inspect where the side effect sits relative to the interrupt and what code is re-entered on resume. A repeated node is not by itself proof of a duplicate payment; the external records are the deciding evidence.
If no payment exists but the final answer says “reimbursed,” compare the resumed tool result with the answer. The failure may be an unsupported completion claim rather than checkpointing.
Keep approval latency and compute latency separate in the review. A reviewer taking an afternoon to respond should not make the model appear slow. The product’s end-to-end time still includes that wait, so preserve both measurements.
Metrics that answer useful LangGraph questions
Use these definitions to design your measurement plan. Calculate them from the required application or tracing evidence; they are not all precomputed dashboard metrics.
| Metric | Definition | Interpretation |
|---|---|---|
| Execution error rate | Failed invocation attempts / recorded invocation attempts | A deliberate interrupt is not an execution error. |
| Pending workflow age | Now minus the time approval was requested | Report still-pending workflows; do not drop them. |
| Confirmed completion | Workflows with a confirmed terminal outcome / eligible workflows | Keep the cohort and observation window explicit. |
Keep thread, conversation, and attempt IDs separate
A thread is the persistent execution context used with LangGraph checkpointing. An invocation is an attempt to advance that context. A product conversation is the sequence the user understands as one interaction. These may share a stable identifier when your application has a one-to-one mapping, but they are different concepts.
| Identifier | Lifetime | Why it matters |
|---|---|---|
| User ID | Across the user’s activity | Separates people and accounts |
| Conversation ID | Related user turns | Reconstructs the product experience |
| Thread ID | Persistent graph state | Continues the right workflow |
| Attempt ID | One invocation or resume | Distinguishes retries and execution segments |
| Action ID | One external operation | Reveals duplicate side effects |
Generate a fresh attempt ID on each invocation. Keep a thread’s conversation ID stable. Never use a shared constant thread ID across users. If a thread is reused for a different customer, observability is not the only problem: state itself may be mixed.
LangGraph’s persistence documentation explains how thread_id addresses saved state. Its interrupt documentation explains pausing and resuming. Verify these behaviors against your installed version, especially if your application consumes streamed results rather than the default invocation output.
Instrument a graph invocation with Agnost
Install agnost in your existing Python application. The following adapter is for an already compiled state graph whose non-streaming result is a dictionary. It records execution segments, not a universal definition of graph completion.
Example scope: the code below is an integration adapter for an existing application. Configure its framework, model, credentials, and output contract as described; the demo screenshots were not generated by running these snippets.
pip install agnost
export AGNOST_ORG_ID="your-org-id"
import os
from uuid import uuid4
import agnost
agnost.init(os.environ["AGNOST_ORG_ID"])
def observed_invoke(graph, graph_input, *, safe_input,
user_id, conversation_id, thread_id,
output_to_text):
interaction = agnost.begin(
user_id=user_id,
conversation_id=conversation_id,
agent_name="langgraph-workflow",
input=safe_input,
properties={
"framework": "langgraph",
"thread_id": thread_id,
"attempt_id": str(uuid4()),
"graph_version": "workflow-v1",
},
)
try:
result = graph.invoke(
graph_input,
config={"configurable": {"thread_id": thread_id}},
)
paused = bool(result.get("__interrupt__"))
# Select and redact your public output; don't serialize all graph state.
output = "Waiting for input or approval" if paused else output_to_text(result)
except Exception as exc:
interaction.end(output=type(exc).__name__, success=False)
raise
else:
interaction.set_property("execution_state", "paused" if paused else "returned")
interaction.end(output=output, success=True)
return resultSupply output_to_text from your application’s state contract—for example, a function selecting the final public answer. Do not dump checkpoint state: it may contain private documents, credentials, or intermediate data the user never saw. safe_input is your sanitized description of this invocation, including a resume when applicable.
The success flag here means invocation processing returned without an exception. A paused run is deliberately labeled paused, not resolved. If your graph uses another output shape or pause mechanism, adapt that detection before using the wrapper. Flush the Agnost SDK at process shutdown; do not shut it down between turns of a shared server.
Observe resumes without turning them into new users
When a person approves a pending action, reuse the graph thread and product conversation. Record a new invocation attempt for the resume. That lets you measure three different durations:
- Active execution before approval was requested.
- Wall-clock time waiting for the human.
- Active execution after approval.
A two-hour approval wait should not appear as two hours of model latency. It may still matter to the user’s end-to-end completion time. Present both durations under accurate names.
An approval also does not prove that the requested action happened. For a refund workflow, record the payment system’s outcome after the approved call. The agent’s statement “refund issued” is weaker evidence than the transaction result.
Add node traces to explain loops and retries
Use the Agnost integration’s OpenTelemetry configuration when you need execution detail beyond the wrapper. Configure the tracing stack once at startup and preserve your existing provider if you already have one. Inspect an actual exported trace to establish which node, tool, and model operations are captured.
Then compare repeated nodes against state changes. A repeated retrieval node may be useful if it changes the query after weak evidence. Repeating the same retrieval with the same input and no new information points to a different problem. Record a compact state transition summary, such as the routing decision or retrieved document IDs, rather than every state field.
Retries need their own attempt context. A transient API failure followed by a successful retry differs from a graph that reaches its recursion limit. Look for the earliest failed dependency and whether later steps recovered. Reporting only the last error can obscure the original cause.
Make side effects safe to interpret
LangGraph can re-enter node code during resumed execution. Review the framework’s interrupt semantics before placing external actions around a pause. Observability can reveal duplicate sends or writes, but cannot make an operation idempotent.
For an illustrative approval workflow, use evidence like this:
| Recorded event | Interpretation |
|---|---|
| Draft created | The agent prepared an action |
| Approval requested | Workflow paused intentionally |
| Approval received | Human authorized continuation |
| Delivery API accepted request | External system accepted the operation |
| Delivery confirmed | Product’s delivery criterion was met |
These are application events to define and instrument, not automatic Agnost fields. Reuse the same action identifier through retries so you can distinguish one action attempted twice from two intended actions.
What to review in production
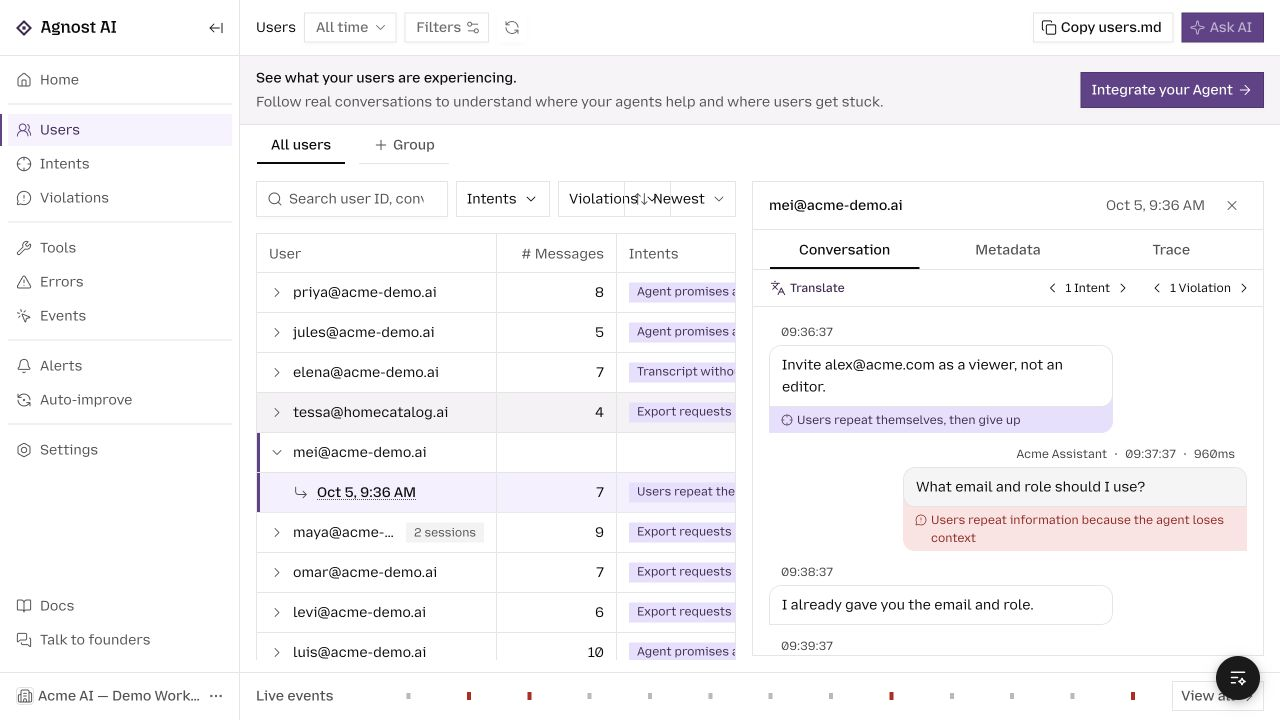
In Agnost, inspect a conversation in Users, then examine the related Events. Start with a concrete question: are users abandoning a particular approval step, are certain routes repeatedly revisiting a node, or did a graph revision increase failures for one intent?
Keep these denominators distinct:
- Failed invocation attempts divided by invocation attempts.
- Completed workflows divided by workflows with an observed terminal state.
- Pending workflows grouped by age.
Show pending and unknown states alongside completion. Excluding them silently can make a system with stuck workflows look healthy. If you sample traces, report that limitation before interpreting rare loops as absent.
Common instrumentation mistakes
Every turn is a separate conversation. Check that your conversation mapping survives request boundaries, rather than creating a new ID inside the wrapper.
One graph has implausibly long latency. Separate active execution from time between invocations and approval waits.
Everything is successful despite pending approvals. Inspect the recorded execution state. A returned call is not necessarily a terminal graph result.
Traces appear twice. Check whether multiple instrumentors or exporters are producing duplicate spans. Keep request-level SDK events separate from node-level spans in metrics.
The trace does not explain a wrong answer. Add the smallest useful evidence at the decision boundary: route selected, validation result, or document references. More raw state does not necessarily make diagnosis easier.
Frequently asked questions
Can I monitor LangGraph without changing every node?
Yes. Start at the invocation boundary and add framework tracing. Add custom spans only where the existing trace cannot explain an important decision or external action.
Is LangGraph monitoring the same as LangChain monitoring?
They share tooling, but persistent graph execution adds concerns such as resumes, checkpoints, and repeated node execution. For a simpler request-to-response agent, start with the LangChain monitoring guide.
Browse all agent observability guides by framework.